Love it or hate it - the Old School RuneScape (OSRS) subreddit in the life of the party! Since the OSRS release, the /r/2007scape subreddit has been the dominant social media platform… but just how popular is /r/2007scape? Has it seen constant, progressive growth? Or has it had peaks of popularity, similar to the OSRS player-base since the release of OSRS in early 2013? This post takes a journey into the history of the OSRS subreddit and presents statistics and accompanying visualizations so you can see the rich history that is /r/2007scape.
Contents
- Data Gathering
- Summary Analysis of /r/2007scape
- Analysis of Six Years of Data from /r/2007scape
- Analysis of Popular Contribution Times
- Top /r/2007scape Contributors
- Conclusion
Data Gathering
I put in a tremendous amount of time and effort into gathering the data needed for the analysis presented in this post. This involved scraping every single submission (post) and comment ever added to the /r/2007scape subreddit since 2013! This resulted in the collection of over 5 GB of raw data! If you are interested in the technicalities of how I collected this data, make sure to check out my post entitled WaterCooler: Scraping an Entire Subreddit (/r/2007scape). In that post, I delve into the technologies, programming code, libraries, APIs and general methods I used to collect the data analyzed in this post. As a one sentence summary: I used the pushshift API coupled with some Python.
Summary Analysis of /r/2007scape
If you want a TL;DR of this post, you are in the right place! The following list presents a summary of all the data analyzed from the 2007scape subreddit. Below are some brief bullet points that summarize the data set I collected.
- Data collection range: 2013-02-14 to 2018-02-14 (six years)
- Number of days in data collection: 2,200 days
- Submissions:
- Total submissions: 808,291
- Average submissions per day: 367.4
- Total NSFW (18+) submissions: 2,957
- Comments:
- Total comments: 9,262,574
- Average comments per day: 4210.3
- Total word count: 214,415,698
- Average word count: 21.29
I found some of the summary statistics amazing! A subreddit for a small, old MMO game that has over 10 million total contributions!
Analysis of Six Years of Data from /r/2007scape
If the previous section has left you wanting more - please continue reading! From here we are going to dig a little deeper into the data and analyze various aspects of the /r/2007scape subreddit, along with comparisons to the OSRS player base and other interesting statistics. We will also try to draw some conclusions with some strange trends that we find along the way. Buckle in!
The First Post
I couldn’t help but include something about the first post on the /r/2007scape subreddit. This was way back on the 14th February 2013… which was interestingly Valentines day! Anyway… a user by the name of AlmostNPC authored a submission entitled First Post!, asking what people thought of the 2007 servers, and received a whopping 4 comments. To be honest, the commenters did not show too much enthusiasm. Little did they (or anyone else) know at the time… this specific subreddit, and OSRS in general, would grow hugely in popularity. Currently, it seems that OSRS has become the dominant game for JaGeX… and has an exceptionally popular subreddit.

Analysis of Submissions and Comments
We just talked briefly about the first post, but how has the subreddit grown since then? To start, we need to clarify the difference in how content on Reddit is organized. In the Reddit world, a submission is the term used when a user submits content. Basically, a submission is the same thing as a post. A user posts some content that they want to share with the community. A comment is any, well comment! When a user replies to a specific submission, they do so in the form of a comment.
We have had six years of the /r/2007scape subreddit. This lifespan has included over 10 million contributions (submissions and comments). But what does the growth in the subreddit look like? Has it been consistent? Have there been spikes? What is the division of submissions versus comments? These were just a few of the questions I had about the data from the 2007scrape subreddit. To start with, the line graph below shows the number of submissions (blue) versus comments (orange) for each month since February 2013. Note that the axis values for comments (right) are 10x that of submissions (left).
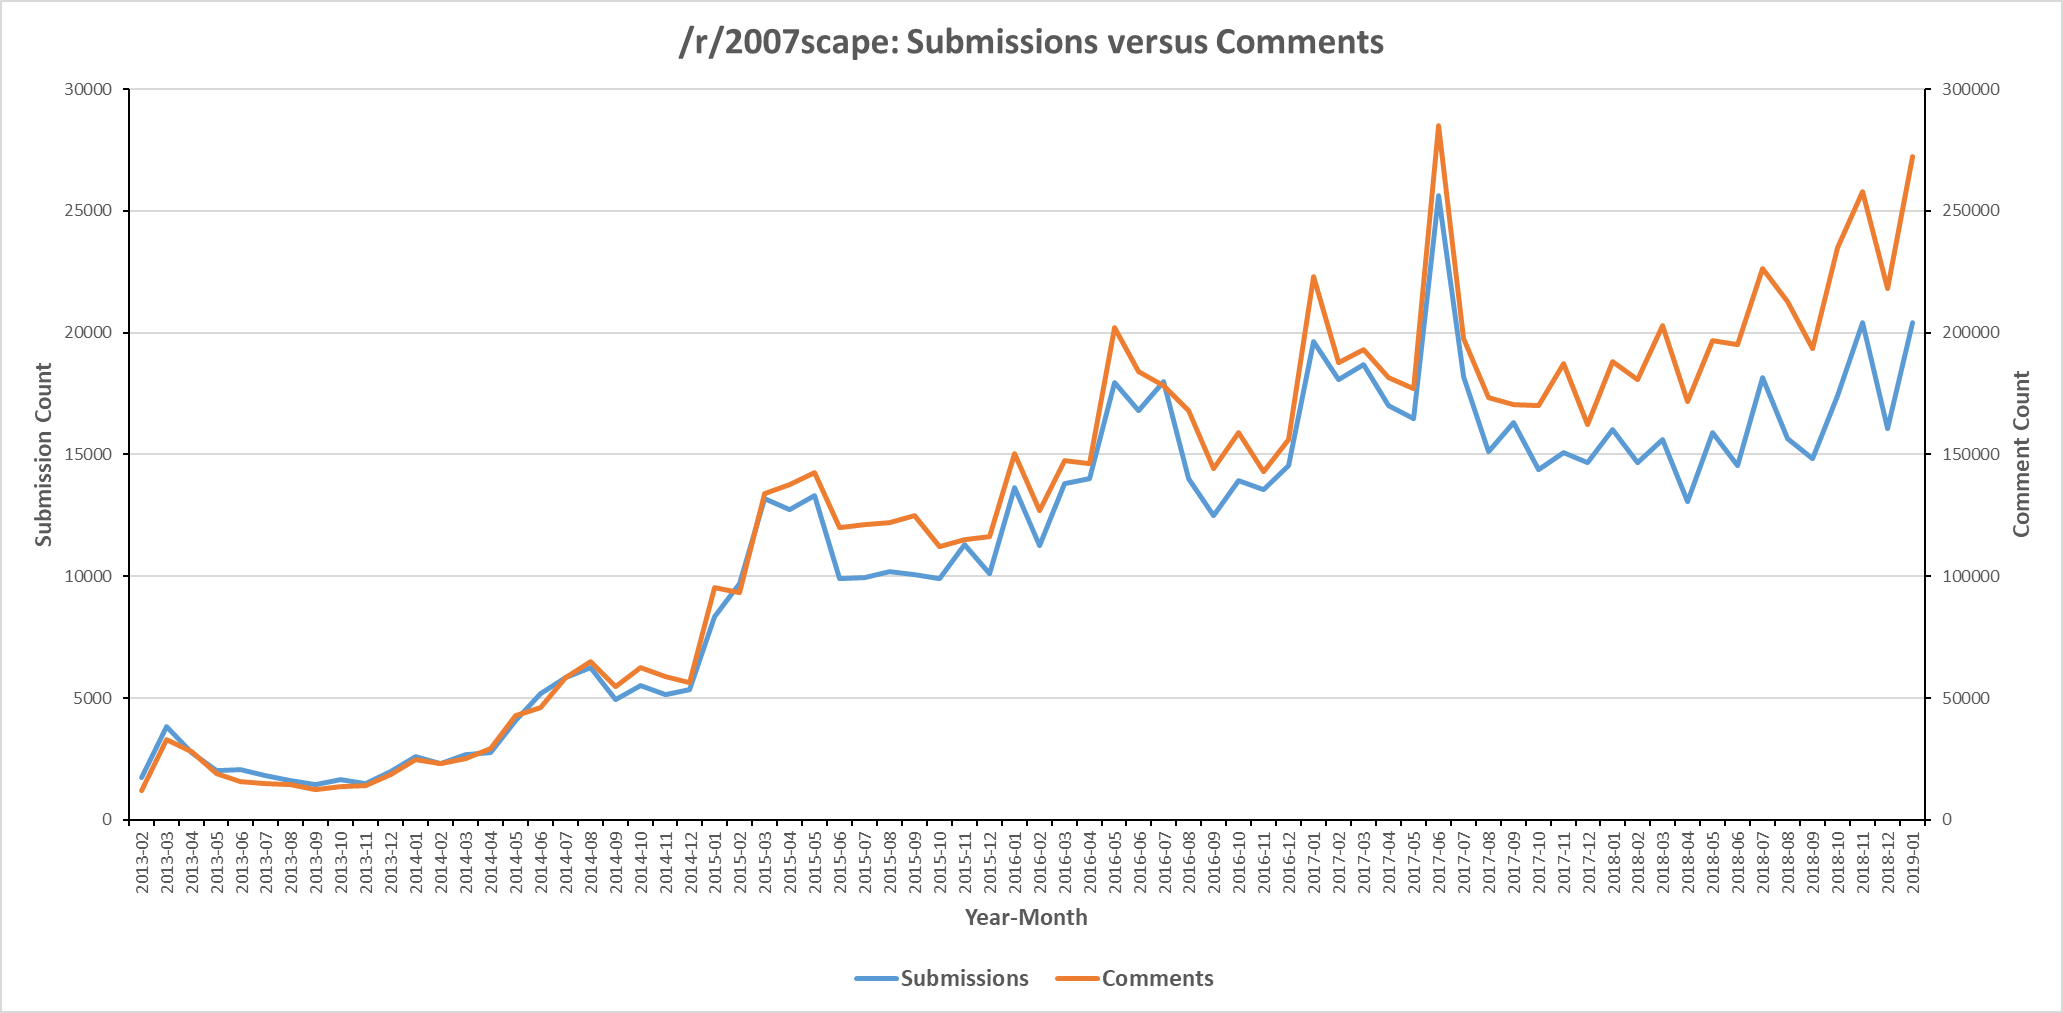
It is quite interesting to look at the number of contributions since 2013, and the general growth pattern. It is also interesting that a quick look reveals an obvious trend between submissions and comments. More submissions mean more comments - and probably vice versa. The two lines follow each other very closely. This makes logical sense. I started comparing my graph of Reddit contributions against a cool graph made by a Reddit user named Phantomat0 who comapred the OSRS timeline with playercount. I wanted to know what caused the spikes and lulls in Reddit usage. A couple of interesting notes:
- There was an initial slow growth in Reddit contributions until around December 2014, where there was the first spike. I think the primary reason for this was the release of Ironman Mode on October 13th, 2014.
- Another spike in January 2017, which seems to be associated with the release of the first raid in OSRS named Chambers of Xeric.
- One of the biggest spikes in Reddit contributions was in June 2017, when the hardest PvM content in the game was released… The Inferno. I remember Reddit during the Inferno release and it was pretty crazy!
- Mobile! Or maybe not! OSRS Mobile was officially released on October 20, 2018. It was in beta on Android devices much earlier and many players already had mobile before the official release. There is no evidence that the mobile release affected Reddit contributions in a specific date range.
If there is one thing to take away from 2007scape contributors - it is going up! And has been going up consistently since OSRS was released. Six years of continued growth for a game you love is pretty nice to see!
Maybe I have been messing around with R too much recently, but I got the overwhelming urge to create a heatmap of the contribution distribution - I was specifically interested in the year/month values as displayed in the previous visualization. I managed to construct a heatmap using ggplot. Basically, the darker (blue) areas show a lower count, while the brighter (yellow) areas dictate a higher count.
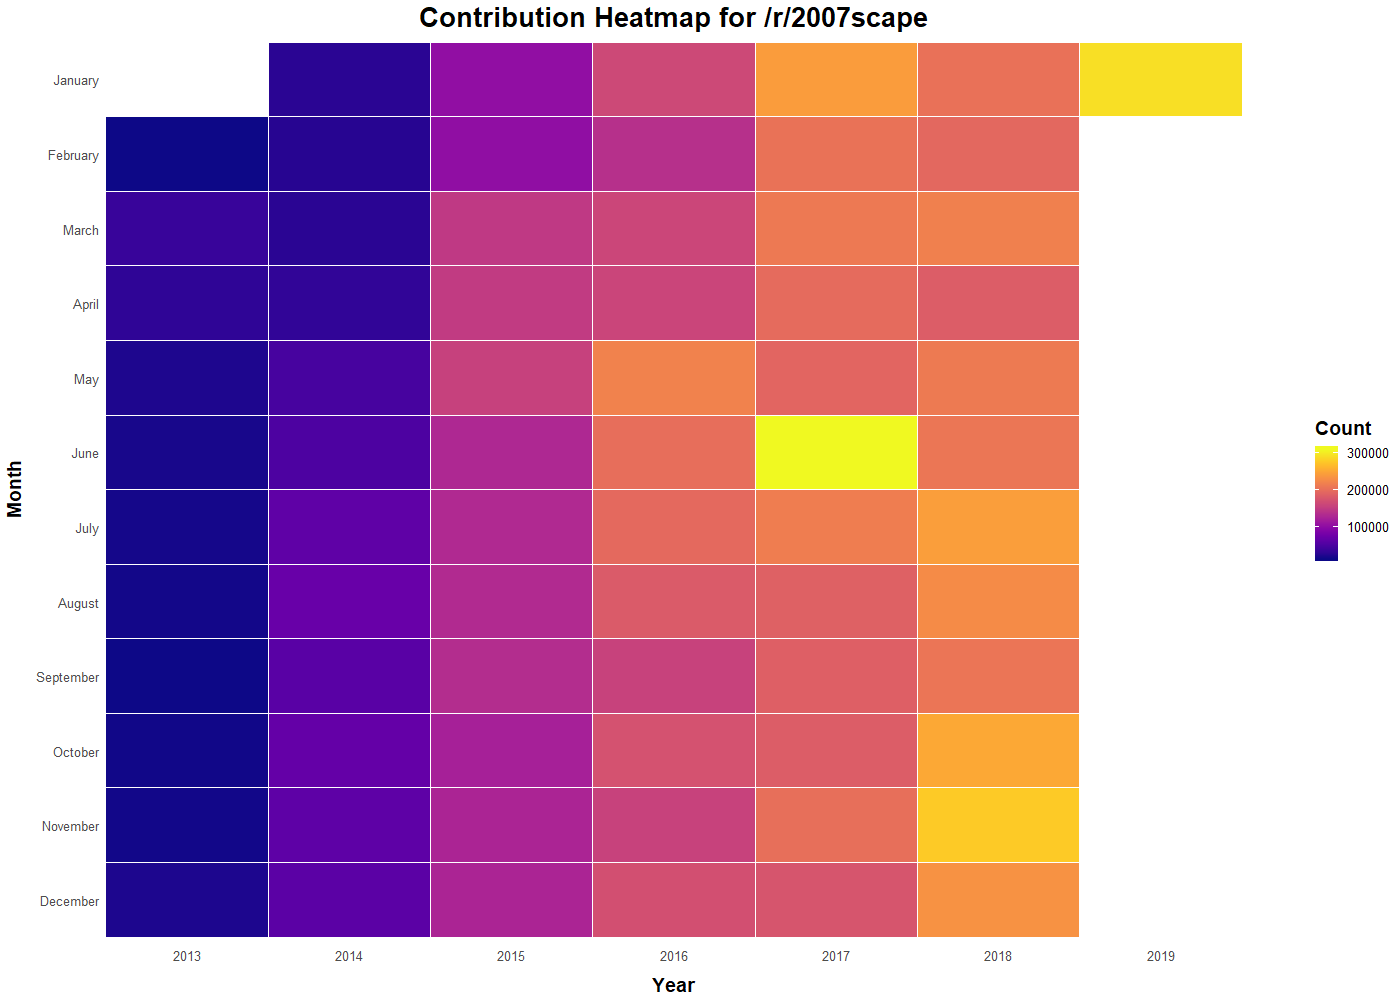
The visualizations show pretty much the same thing. But the spike in June 2017 seemed much more prominent in the heatmap. Indeed - it was the /r/2007scape peak in user contribution. Nevertheless, the consistent growth in the number of contributions is evident.
Analysis of Contributions and Subscribers
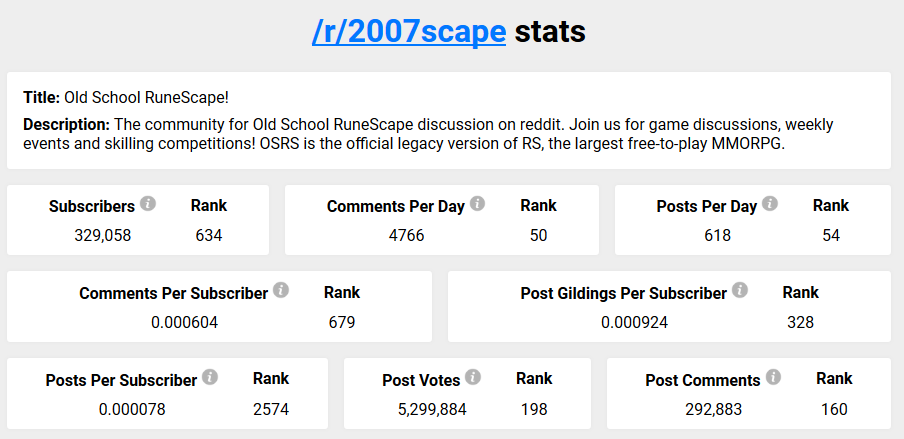
The next data crunching exercise was to look at the number of 2007scape subscribers. But first, I needed to get the subscriber data from somewhere… This information is not available from the pushshift API, so I went searching for another data source. I found an interesting website called Subreddit Stats which provides data on subreddits including submissions, comments, and growth. The 2007scape page from Subreddit Stats is very interesting. The screenshot below shows the base stats for the /r/2007scape subreddit.
Anyway… Subreddit Stats provides subreddit subscriber information. The data for subscriber information dated back to pre-2013, so I was able to get the subscriber data from the start of the 2007scape subreddit back in 2013. However, they only have submission and comment data for the last 6 months. So I extracted the subscriber count and mapped it against the submission/comment counts that I already had.
The graph below shows the number of Reddit contributions (submissions and comments) to 2007scape (orange) versus subscribers (blue) for each month since February 2013. Note that the y-axis values are using the same scale.
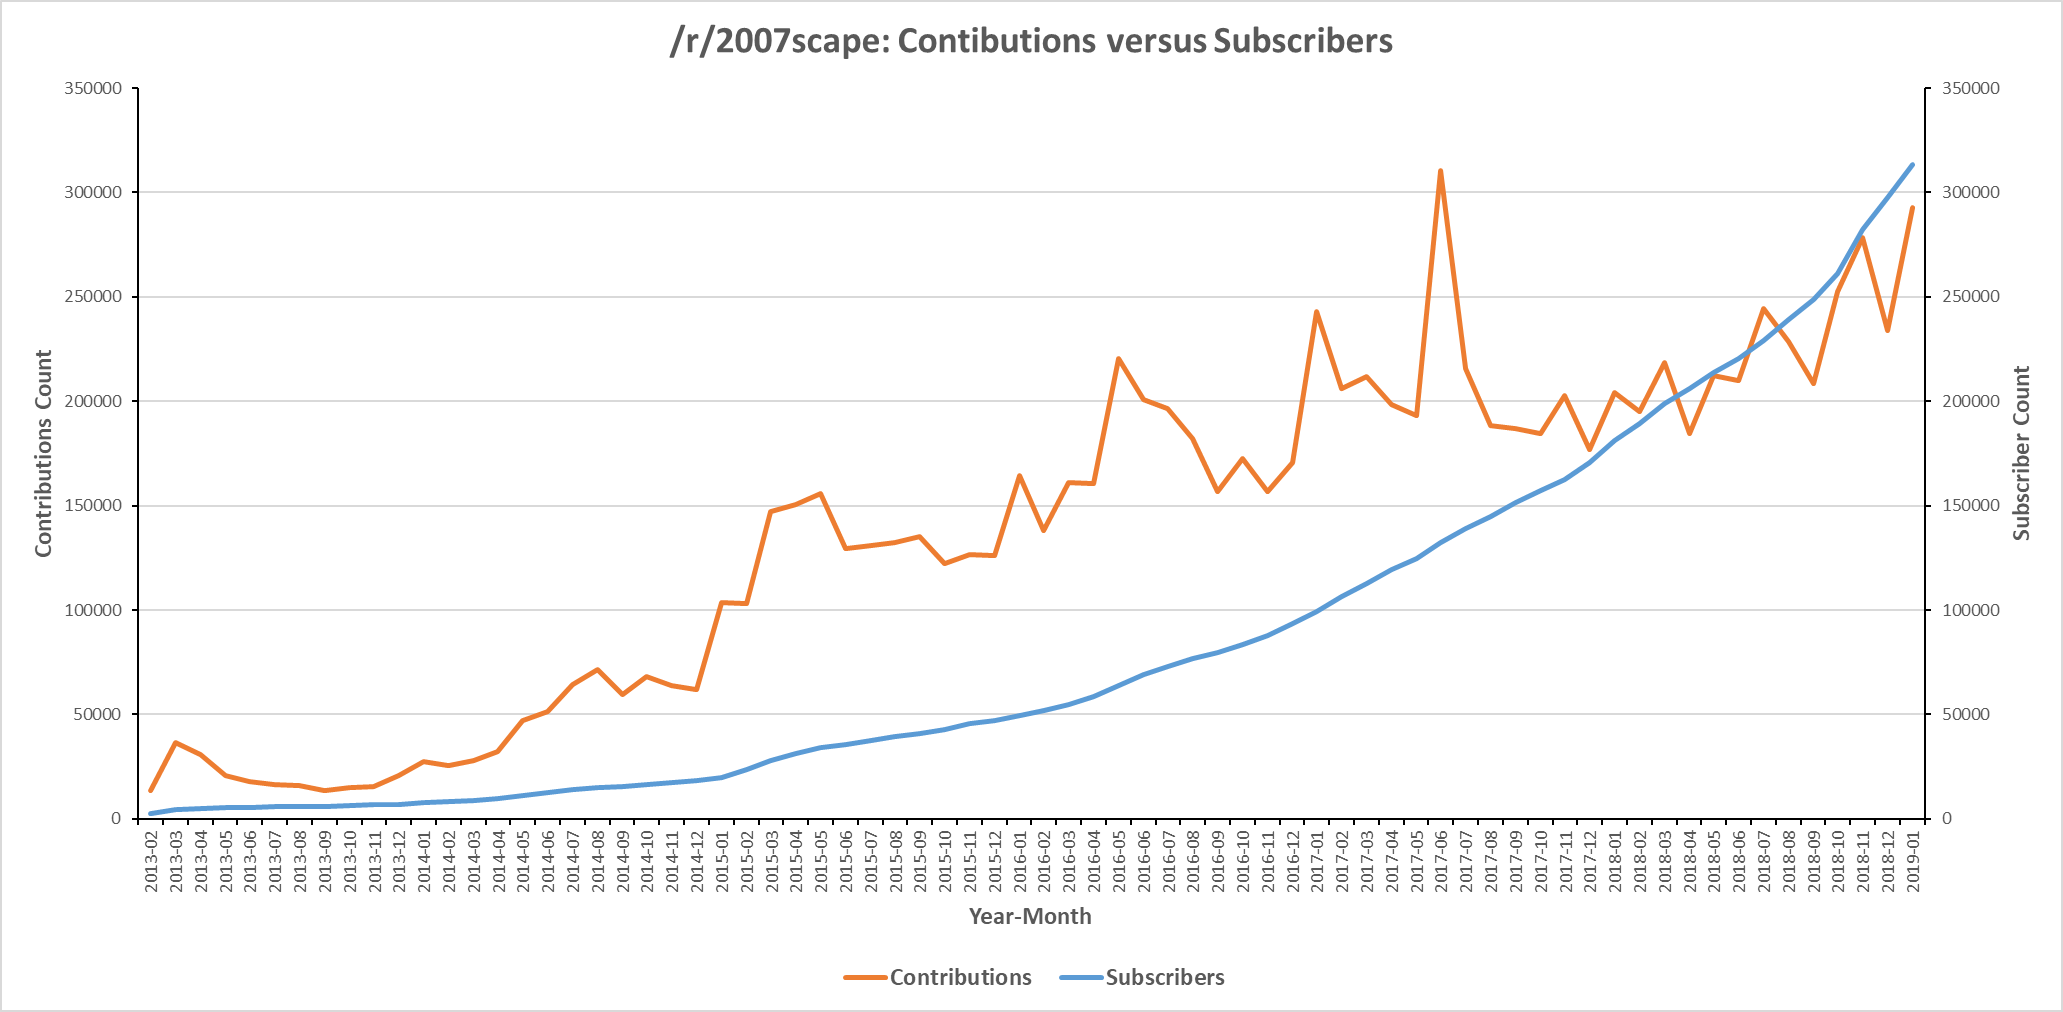
That blue line of subscribers is soooooooo satisfying! It was a slow start, but the graph above really demonstrates the continued growth of 2007scape subscribers. Recently, the subreddit just clocked over 300,000 subscribers. And as of 2019/03/08, there are 329,000 subscribers.
Analysis of Contributions and Player Count
The next comparison I wanted to make to the 2007scape subreddit data, was OSRS player count. Again, the first thing to do was to find the data on player count that had historical data going back to the start of 2013. This was pretty easy… I already knew of the OSRS world population graph from Misplaced Items. This amazing individual has been tracking player count (in OSRS and RS3) since the release of OSRS.
To get the player count data, I simply selected to display Granularity by Month, then extracted the raw data from the web page source code. I then processed the player count data with my 2007scape subreddit data and graphed the results.
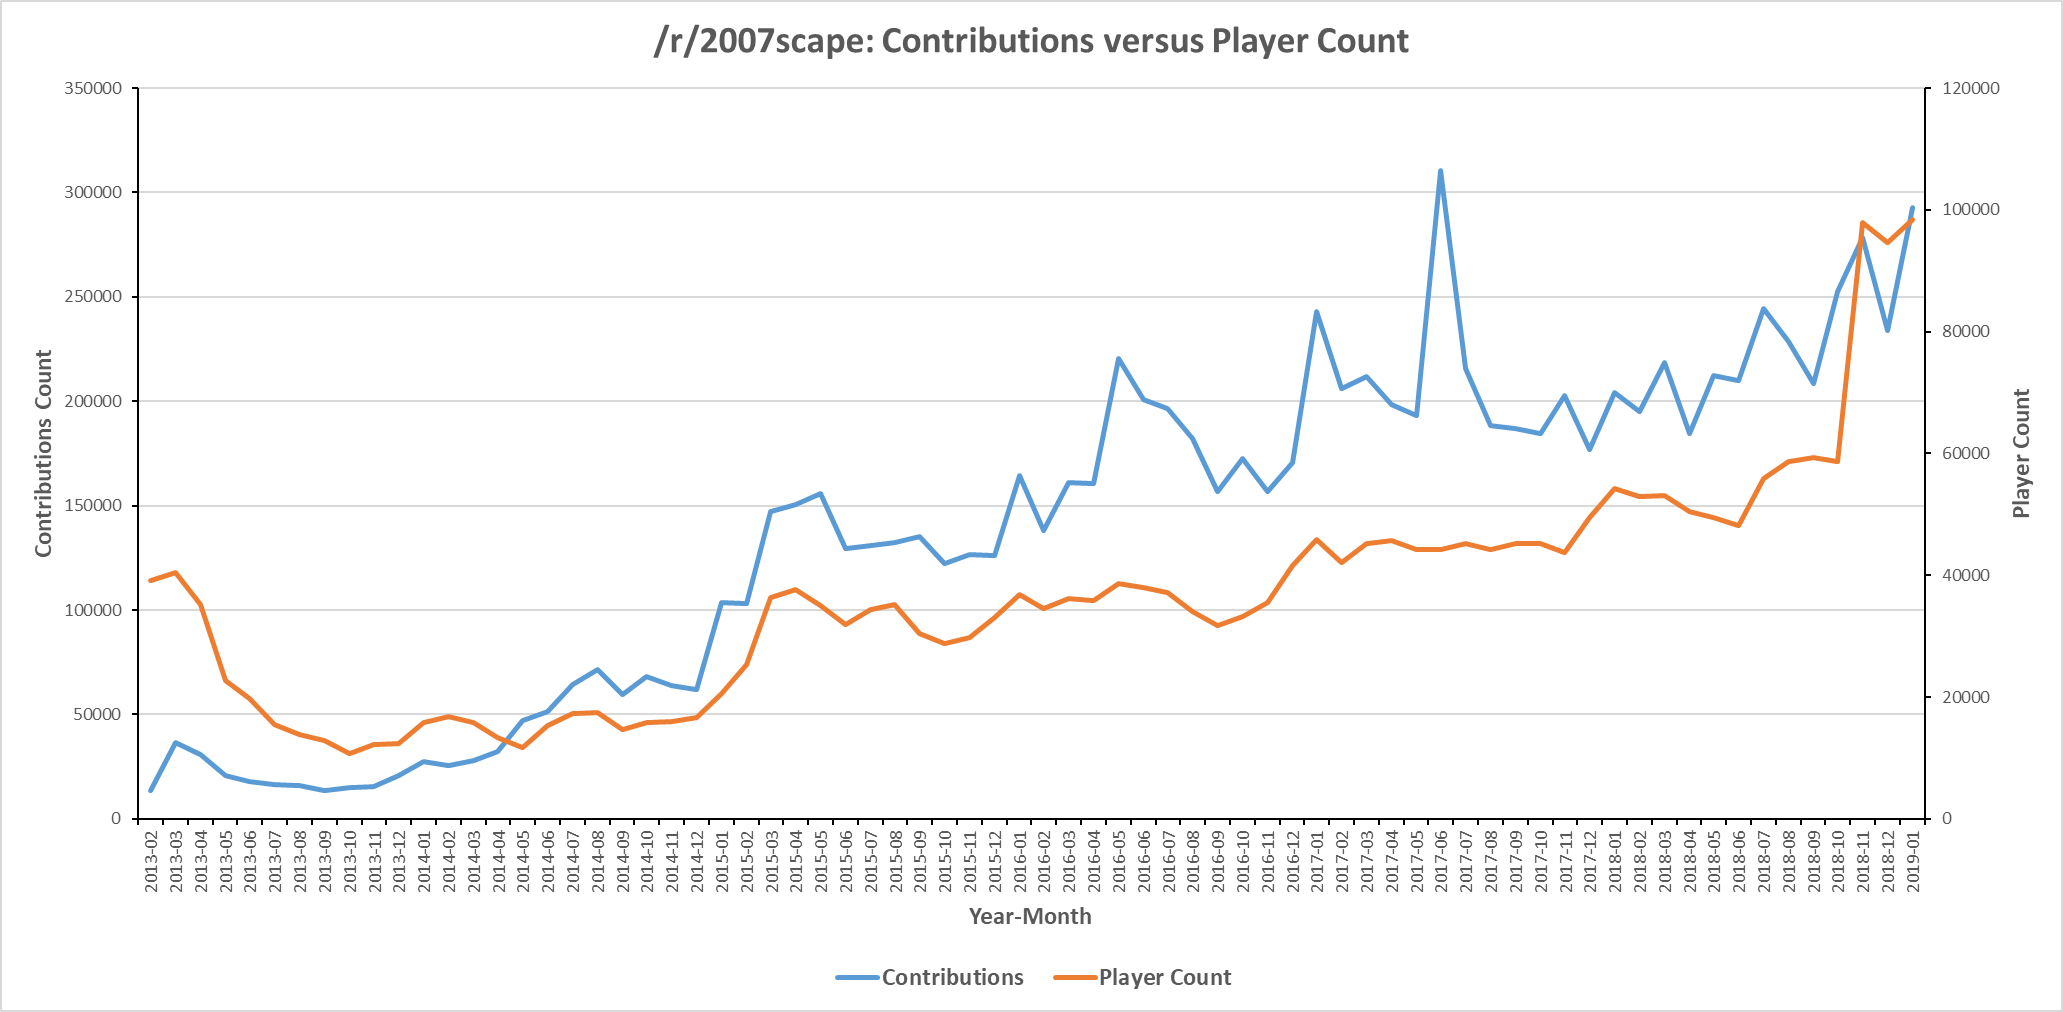
The graph below shows the number of Reddit contributions (submissions and comments) to 2007scape (blue) versus OSRS player count (orange) for each month since February 2013. Note that the y-axis values for contributions (right) and player count (left) use the same scale.
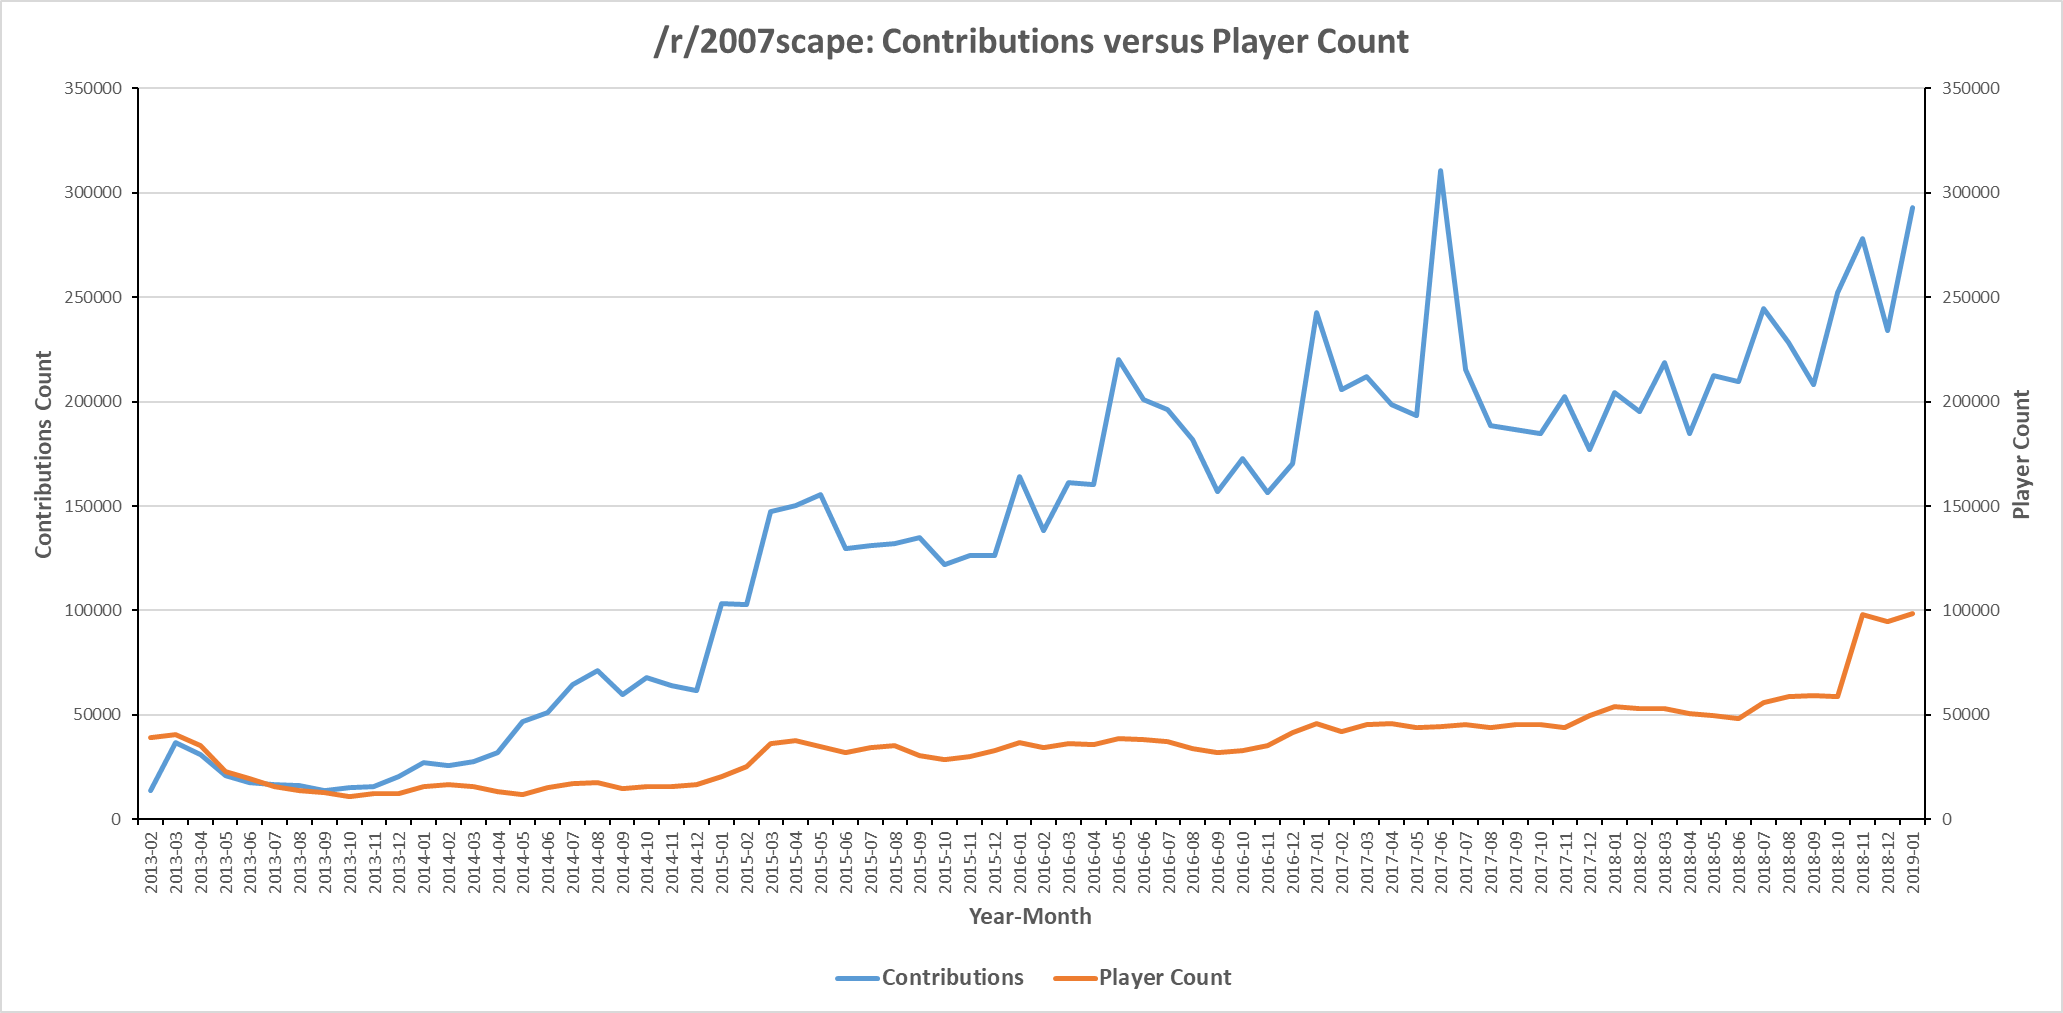
This graph left me a little underwhelmed. There seemed to be no correlation between OSRS player count and 2007scape contributions. I re-looked at the raw data, ran a few quick scripts to compare values and was sure there was a trend between each property. Then I simply refined the y-axis value for the player count and saw the trend I was expecting.
Analysis of Popular Contribution Times
So far we have looked at the raw data from the 2007scape subreddit and compared it to subscriber count and OSRS player count. The next thing I wanted to determine if the most popular time of the day/week to submit a post or write a comment. I have some idea what the popular time of day (in my timezone) for the 2007scape subreddit based on browsing it for a few years, but I wanted concrete evidence of the most popular days of the week and time of day.
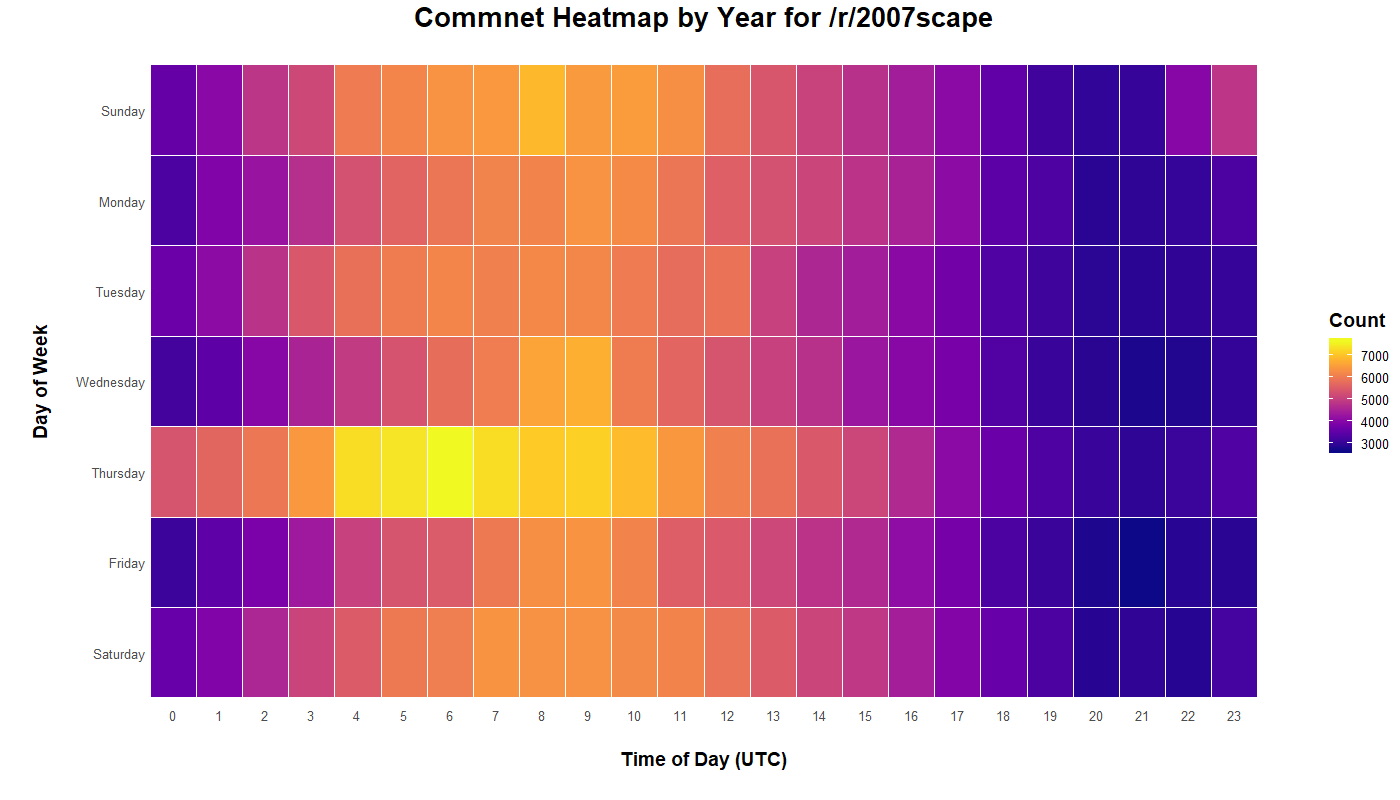
The pushshift API stores all Reddit submissions and comments in UTC time. The UTC time is also commonly known as Greenwich Mean Time (GMT) - they are synonymous. The heatmap visualization below displays the most popular contribution (submissions and comments) time based on time of day (per hour) versus day of the week for each year, ranging from 2013 to 2018. I decided to exlude 2019 as I only have data from January and the start of February in the dataset.
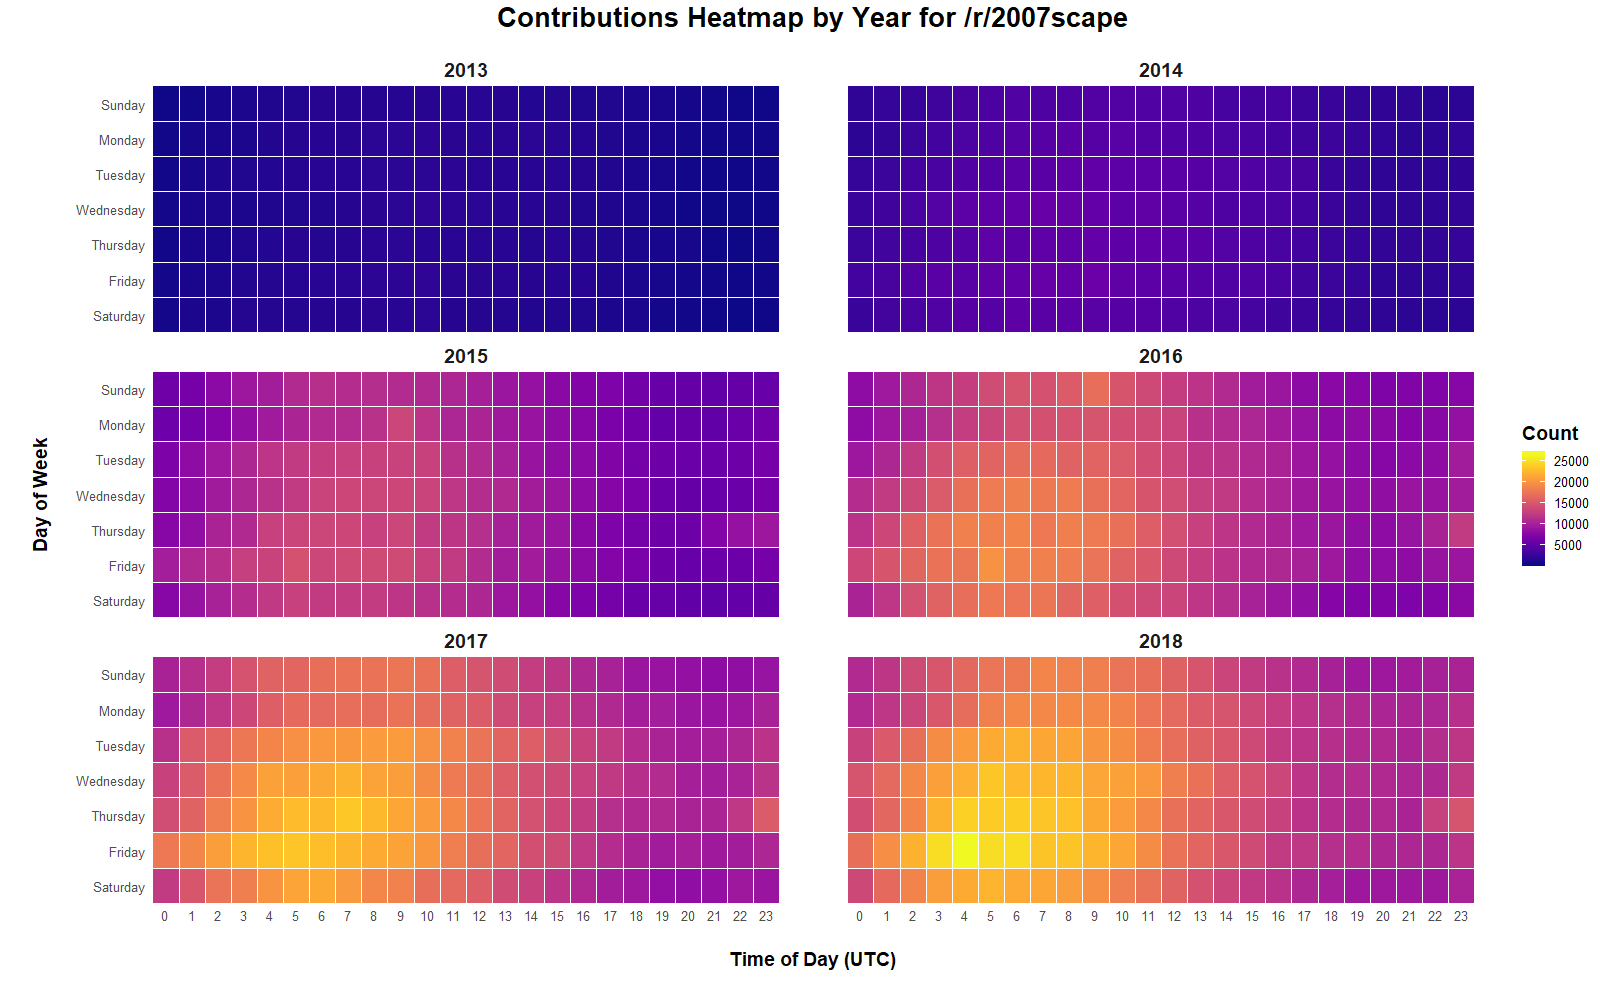
Basically, the lighter color represents the more popular day of week and time of day of contributions. What is really interesting is seeing the gradual increase in contributions as time progressed. In 2017 and 2018, we have seen much more growth in terms of the number of contributions to the OSRS subreddit.
Next, I wanted to just determine the most popular time of the week to make a submission (post). So I amalgamated all of the data from every year and mashed it into one single heatmap. The heatmap visualization below shows the correlation of the day of the week versus time of the day.
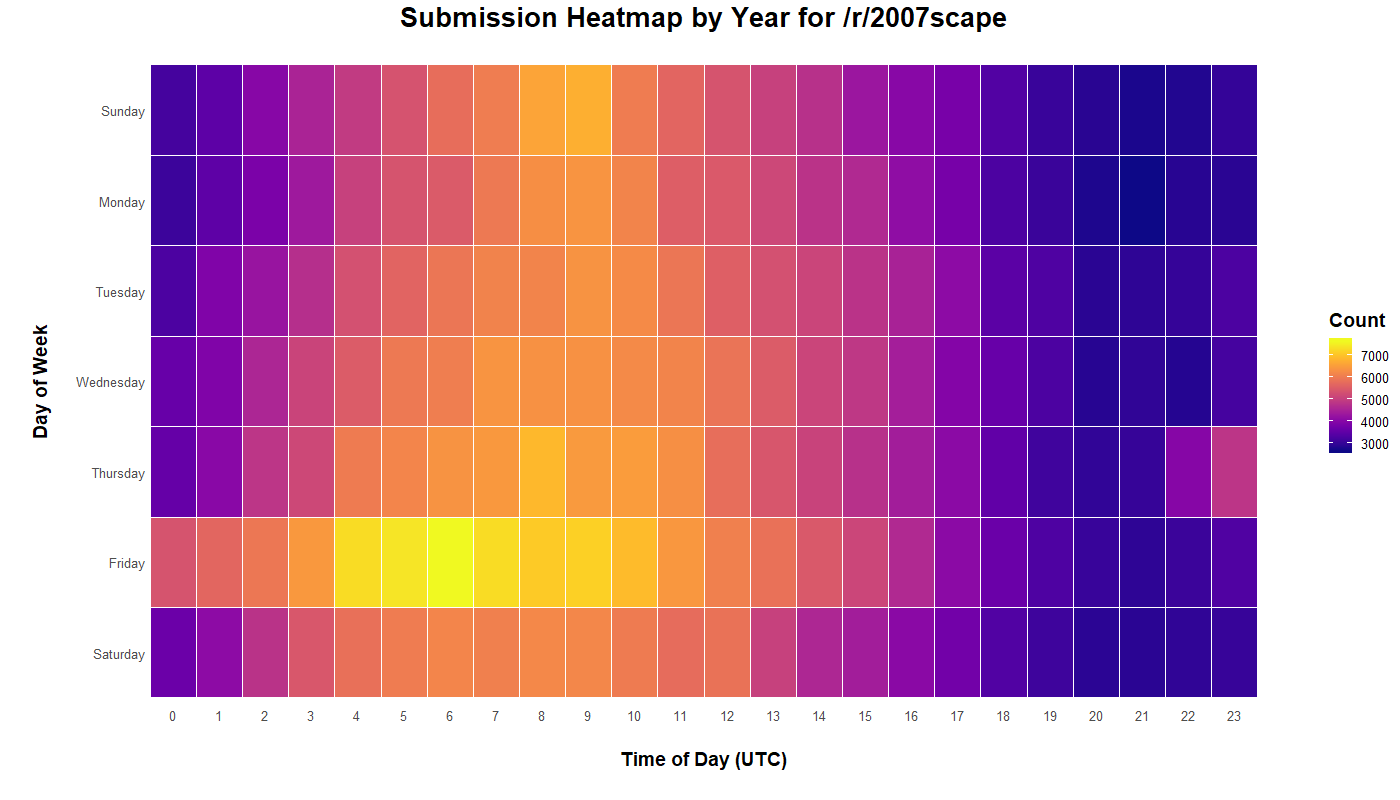
It is pretty obvious that the yellow portion of the heatmap is around Friday 4-9am. FYI - this is the time of the week where OSRS has its usual weekly update. We can see that this time of the week is a very popular time to make a submission. The heatmap visualization below shows the same amalgamation of the six-years worth of /r/2007scape data for comments.
This is a little more interesting. The heatmap above shows a strong trend of 4-9am being a popular time to post comments on a Thursday. Maybe this is caused by the stickied post of the weekly Q&A, which always receives a lot of comments when players want to ask the OSRS Mods questions.
Top /r/2007scape Contributors
So far we have looked at the raw data from the 2007scape subreddit and compared it to subscriber count, OSRS player count and the most popular time of day to post content. The last thing I wanted to investigate was the top contributors to the 2007scape subreddit. For a subreddit to have over 10 million unique contributions (submissions and comments) there must be some people who are tirelessly contributing! Similar to the previous analysis, I wanted to split this into submissions, then comments. I arbitrarily choose to determine the top 20 because I thought it sounded good!
The top 20 is determined by submission or comment count. Unfortunately, the pushshift API does not provide accurate upvote data - as each submission or comment is extracted very soon after user contribution. The effort to determine upvotes would require me to grab the upvote status from the Reddit API for over 10 million contributions (maybe a future project?!). Anyway, the sections below list the top 20 contributors for submissions, then comments.
Top 20 Submitters
Like we previously discussed… a submission is the Reddit term for posting content. So, the table below displays the top 20 submitters to the 2007scape subreddit based on the submission count.
| Rank | Author | Count |
|---|---|---|
| 0 | [deleted] | 143817 |
| 1 | AutoModerator | 1344 |
| 2 | rawktail | 667 |
| 3 | Beratho | 619 |
| 4 | Gameboto4 | 583 |
| 5 | deanzynut | 498 |
| 6 | OsrsNeedsF2P | 473 |
| 7 | Herb_Quest | 438 |
| 8 | Avnas | 437 |
| 9 | Lnfinite_god | 434 |
| 10 | IkWhatUDidLastSummer | 428 |
| 11 | alstablieft | 427 |
| 12 | Pops_rustafied | 403 |
| 13 | rudyv8 | 400 |
| 14 | ProktosRS | 396 |
| 15 | BoulderFalcon | 392 |
| 16 | rank_1_glad | 385 |
| 17 | Shortdood | 381 |
| 18 | TheNote7 | 380 |
| 19 | EdHicks | 377 |
| 20 | RNGreed | 374 |
I knew that a lot of contributors would post a submission, then delete it. So it comes as no surprise that the top “submitter” is the [deleted] username. After a little research, it seems that the [deleted] username appears when a user deletes their submission/comment, or when they delete their account. So, I marked the [deleted] username to the zero index (0) value, to show it in the analysis - but not really include it as the top contributor.
So… the top contributor is a bot. Not much of a surprise there either. The AutoModerator for the 2007scape subreddit has been working overtime making submissions! A total of 1,344 submissions! The primary cause of this is the Have a question about the game or the subreddit? Ask away! post that the AutoModerator posts daily.
OK… on to the real people! The top contributor of posts to the 2007scape subreddit is: rawktail with 667 posts. That is pretty amazing! A close second is Beratho with 619. I thought I would recognize a couple more names on this list, as I am constantly browsing the 2007scape Reddit. But many of these were new to me. Nevertheless, I think all of these people on this list deserve a thank-you for supporting the OSRS community - unless they are shit-posters! - jk.
Top 20 Commenters
Like we previously discussed… a comment is the Reddit term for, well, commenting on a post. So, the table below displays the top 20 commenters to the 2007scape subreddit based on the comment count.
| Rank | Author | Count |
|---|---|---|
| 0 | [deleted] | 632274 |
| 1 | AutoModerator | 33905 |
| 2 | BioMasterZap | 29623 |
| 3 | Shortdood | 24166 |
| 4 | Serene | 18996 |
| 5 | S7EFEN | 17445 |
| 6 | EdHicks | 16969 |
| 7 | tom2727 | 14570 |
| 8 | threw_it_up | 13792 |
| 9 | Purge2202 | 11696 |
| 10 | DivineInsanityReveng | 11093 |
| 11 | OSRS_HELL | 10973 |
| 12 | celery_under | 10097 |
| 13 | zekerman | 9256 |
| 14 | Tyler_OSRS2002 | 9043 |
| 15 | mogotrevo | 8929 |
| 16 | PttB_Viper | 8915 |
| 17 | BasicFail | 8847 |
| 18 | Faladorable | 8740 |
| 19 | Supergigala | 8595 |
| 20 | Kupopallo | 8449 |
Once again, the [deleted] username takes the top stop - well, it gets the zero index (0) spot. AutoModerator comes in second with automated replies. But… wow! The top commenter that is an actual person is BioMasterZap with almost 30,000 comments. That is freaking ridiculous! Second is Shortdood with approximately 24,000 comments. These numbers are crazy! Every user on this list has more than 8,000 comments.
Conclusion
This post is probably the reason the blog has been a little quiet lately. I try to post consistently, but this project really took some effort to reach the finish line. Throughout this project I researched how to get subreddit data, learnt how to use the pushshift API, scraped over 5GB of /r/2007scape contributions, wrote about 30 Python scripts to process the data, and leared R programming to make some heatmaps! It was quite a journey, but well worth the effort.
I still have all the /r/2007scape subreddit data, so if you are interested in an anlysis about an area I have not covered, please post a comment below. Also very open to hear any feedback you might have on this post. Until next time, happy scaping everyone!